Your restaurant menu is doing more than listing dishes and prices—it’s either making you money or leaving profit on the table. An expertly designed menu can increase restaurant profits by 10-20% within the first year, yet most restaurant owners treat their menu as an afterthought.
Menu engineering is a strategic methodology that combines profitability analysis, customer psychology, and data-driven design to optimize menu item placement, pricing, and presentation. It works because guests spend under two minutes reviewing menus before making purchasing decisions—making every design choice, every description, and every placement decision count toward your bottom line.
The methodology systematically examines the relationship between a dish’s profit margin and its popularity, using categorization frameworks to guide data-driven decisions. Through this analysis, you’ll identify which items deserve prime menu real estate, which need recipe adjustments, and which should be removed entirely.
Studies confirm that menus undergoing menu engineering can increase profits by more than 15%. One documented case showed a restaurant achieving 31% food cost (reduced from 38%), an 18% gross profit increase, and $84,000 in additional annual profit—all while maintaining stable customer satisfaction.
This guide covers everything you need to make your menu a profit-generating tool: the menu engineering matrix, profitability calculations, menu psychology principles, pricing strategies, and step-by-step implementation. Whether you’re running a food truck or managing a full-service restaurant, you’ll walk away with actionable strategies to optimize your menu and increase sales.
Menu engineering is the study of profitability and popularity of menu items and how these factors affect menu placement. It’s a systematic approach that uses contribution margin (selling price minus food cost) as the primary profitability metric, combined with sales data analysis to guide strategic decisions about your menu offerings.
The concept was developed by Michael Kasavana and Donald Smith at Michigan State University in 1982. They applied principles from the Boston Consulting Group Matrix—originally designed for portfolio management—to restaurant menus. Their research demonstrated that strategic menu design could significantly impact restaurant profitability without requiring additional marketing spend or operational changes.
The fundamental principle behind menu engineering is straightforward: not all menu items contribute equally to your profits. Some dishes are both popular and profitable (your menu’s MVPs), while others drain resources without delivering returns. By understanding where each item falls, you can make informed decisions about pricing, placement, and menu composition.
Menu engineering is both art and science. The data tells you what’s working and what isn’t, but applying that knowledge requires creativity and understanding of your specific customers.
Today’s menu engineering goes beyond print menus. With digital menus, restaurants can test changes instantly, track performance in real-time, and engineer your menu without reprinting costs. This means the principles of menu engineering that once required significant investment can now be applied by any food business, regardless of size.
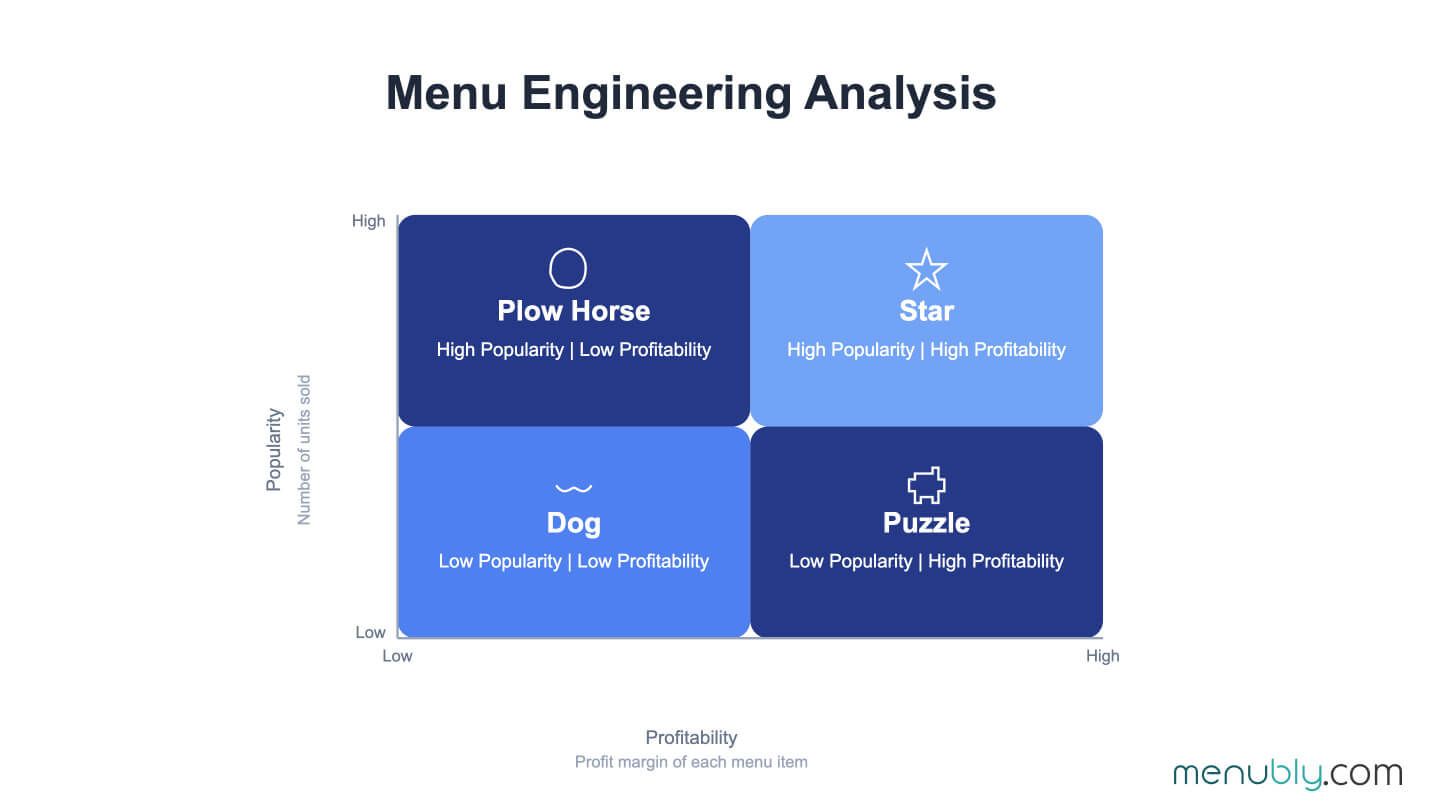
The menu engineering matrix is your primary tool for classifying and strategizing around each menu item. It’s a simple 2×2 grid with two axes:
Every item on your menu falls into one of four categories based on where it lands on this matrix. Each category requires a different strategic approach.
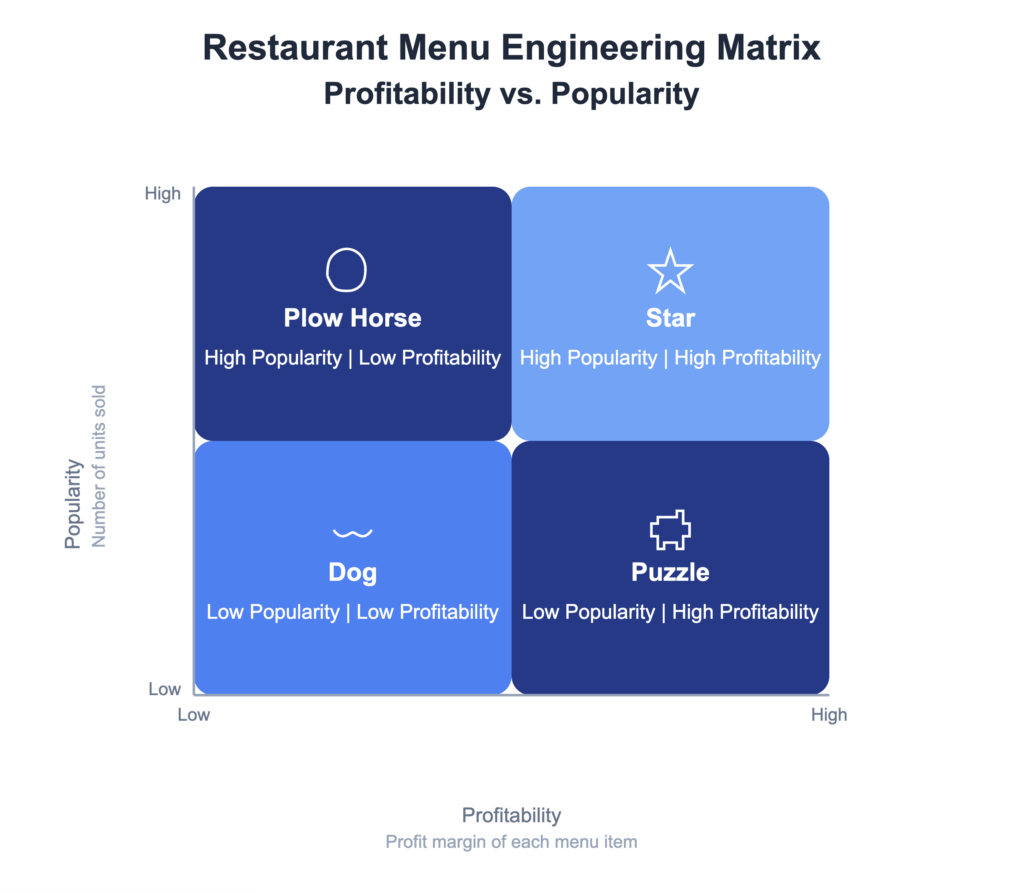
| Category | Profitability | Popularity | Primary Strategy |
|---|---|---|---|
| Stars | High | High | Maintain & Feature |
| Plowhorses | Low | High | Increase Margin |
| Puzzles | High | Low | Increase Visibility |
| Dogs | Low | Low | Remove or Re-engineer |
Stars are menu items with both high profitability and high popularity—your best-performing dishes that customers love and that generate strong profit margins. These are the items that drive your business forward.
Characteristics of Star Items:
Examples: A signature burger with premium toppings, a house specialty pasta, a craft cocktail with high-margin spirits.
Strategies for Stars:
The biggest mistake restaurants make with stars is over-engineering them. Your primary job is protection: ensure consistent execution and keep these items visible. Feature your stars with high-quality photos and compelling descriptions—digital menus let you highlight these items with visual emphasis that print menus can’t match.
Plowhorses are menu items with high popularity but low profitability. Customers order them frequently, but they don’t contribute much to your bottom line. These items are challenging because removing them would upset loyal customers, but keeping them as-is hurts your margins.
Characteristics of Plow Horse Items:
Examples: Popular pasta dishes with expensive ingredients, basic burgers with premium beef, large salads with costly toppings, house favorites priced too low.
Strategies for Plowhorses:
Test price changes without commitment. With a digital menu, you can adjust a plowhorse’s price and monitor sales response instantly—something impossible with printed menus. The key is making changes gradually so loyal customers don’t feel alienated.
Puzzles are high-profit menu items with low popularity. They generate good margins when sold but don’t get ordered often. These represent your biggest optimization opportunity—if you can increase sales of puzzles, you boost profitability without changing recipes or suppliers.
Characteristics of Puzzle Items:
Common Reasons for Low Popularity:
Examples: Specialty seafood dishes, chef’s signature creations, ethnic dishes with unfamiliar names, seasonal specials.
Strategies for Puzzles:
Digital menus make puzzle optimization effortless. Reposition items, update menu descriptions, add mouthwatering photos—all in minutes. Test different approaches and track which drives more orders. Some puzzles may need removal if no strategy works, but most can be transformed with the right visibility boost.
Dogs are menu items with both low profitability and low popularity. They take up menu space without contributing to revenue or customer satisfaction. These items are hurting your business.
Characteristics of Dog Items:
Why Dogs Accumulate:
Decision Framework:
Remove if:
Retain if:
Re-engineer if:
Removing a dog from your digital menu takes seconds—no reprinting, no wasted materials. Test the removal and monitor if anyone notices. Often, they don’t.
Letting go of menu items can feel personal, especially if they were your idea or have history. But your menu’s job is to generate profit, not preserve nostalgia.
Before you can classify items on the matrix, you need to calculate two things for every menu item: contribution margin (profitability) and menu mix percentage (popularity). Here’s how to do both.
Formula: Contribution Margin = Selling Price – Food Cost
Contribution margin tells you how much profit each item generates before covering other expenses. This is the number that matters most for menu engineering—not food cost percentage.
Example Calculation:
Why Contribution Margin Matters More Than Food Cost Percentage:
Here’s a comparison that illustrates this point:
Even though the steak has a higher food cost percentage, it contributes more actual profit per sale. When engineering your menu, focus on contribution margin, not just percentages. Use a food cost calculator to quickly determine these numbers for each item.
Formula: Food Cost Percentage = (Food Cost ÷ Selling Price) × 100
While contribution margin is more important for menu engineering decisions, food cost percentage helps you understand your overall cost structure and compare against industry benchmarks.
Example: A dish with $8 food cost and $24 selling price: ($8 ÷ $24) × 100 = 33.3% food cost
Industry Benchmarks:
For accurate cost calculations, use a recipe cost calculator to determine the exact cost of ingredients for each menu item.
Formula: Menu Mix Percentage = (Units of Item Sold ÷ Total Units Sold) × 100
Menu mix percentage shows how popular each item is relative to total sales.
Example: If you sold 120 Grilled Salmon dishes out of 800 total items sold, the salmon’s menu mix is: (120 ÷ 800) × 100 = 15% menu mix
Calculating Expected Popularity:
To determine if an item is “popular” or “unpopular,” you need a benchmark. The industry standard is:
Expected Popularity = (1 ÷ Number of Items) × 70%
The 70% multiplier accounts for the fact that some items will always outsell others.
Example: If you have 25 items on your menu:
To classify items on the matrix, you need clear thresholds for “high” versus “low” profitability and popularity.
Profitability Threshold:
Calculate the weighted average gross profit across all items. This becomes your dividing line.
Example Calculation:
Popularity Threshold:
Use the 70% of expected popularity formula calculated above.
Pro Tip: Analyze by category (appetizers, mains, desserts) for more accurate insights. A popular appetizer has different sales volume than a popular entrée.
Pull sales data from your POS system—most systems can export item-by-item sales reports for any date range. If you’re using an online menu with built-in ordering, your sales data is already captured and easy to access.
| Item | Selling Price | Food Cost | Contribution Margin | Food Cost % | Units Sold | Menu Mix % | Classification |
|---|---|---|---|---|---|---|---|
| Grilled Salmon | $24 | $8 | $16 | 33.3% | 120 | 15% | Star |
| Classic Burger | $14 | $5 | $9 | 35.7% | 200 | 25% | Plowhorse |
| Lamb Shank | $28 | $10 | $18 | 35.7% | 15 | 1.9% | Puzzle |
| Veggie Wrap | $11 | $4 | $7 | 36.4% | 10 | 1.25% | Dog |
Customer eyes follow predictable patterns when reviewing menus, and understanding these patterns allows you to place high-profit items where they’re most likely to be seen and ordered.
Eye-tracking research has identified common gaze patterns on menus. On a two-panel menu, customers typically look:
This “golden triangle” is your prime real estate. Place stars and puzzles in these high-visibility positions.
Placement Strategies:
Important Note: Digital menus on phones follow different patterns—customers scroll top-to-bottom. For mobile-first menus, category organization and search features become more important than traditional placement rules.
How you present prices affects customer perception and ordering behavior.
Proven Price Presentation Tactics:
Example:
Descriptive labels increase sales by up to 27%. The words you use to describe dishes directly impact what customers order.
Types of Effective Descriptions:
Description Transformation Example:
Update descriptions anytime to test what resonates. Track which versions drive more orders and continuously optimize your menu copy. Learn more about writing effective menu descriptions that convert browsers into buyers.
Techniques to Draw Attention:
Photo Impact: High-quality menu item photographs can increase sales by 30% or more compared to text-only descriptions. However, poor-quality photos hurt more than no photos at all. Invest in professional menu photography or use natural lighting and clean backgrounds for DIY shots.
Category Organization:
Digital menus make visual optimization easy—add photos, adjust layouts, and customize branding without design expertise. Mobile-optimized menus automatically adapt for perfect viewing on any device.
There’s no single “right” way to price menu items. Successful restaurants combine multiple approaches based on the item, competitive landscape, and customer expectations.
Formula: Menu Price = Food Cost × Multiplier
The most common approach multiplies ingredient cost by 3-4× to achieve 25-33% food cost percentage.
Example:
Best for: Standard menu items, new items without sales history, quick calculations
Limitation: Doesn’t account for customer perceived value or competitive pricing
Formula: Menu Price = Food Cost + Target Contribution Margin
Instead of targeting a percentage, you target a specific dollar profit per item.
Example:
Best for: High-volume items, items with consistent food costs, margin-focused analysis
Price relative to local competitors for similar items.
Approaches:
Best for: Commodity items (burgers, pizza), new market entries, competitive markets
Price based on customer perceived value rather than cost.
When to use:
Example: A dish with $8 cost might price at $32 (4× markup) if the experience, presentation, or ingredient quality commands premium positioning.
When to Raise Prices:
How to Raise Prices:
Digital menus eliminate the biggest barrier to smart menu pricing—the cost and delay of menu reprints. Test price adjustments on specific items, monitor sales response, and find your optimal price points through real data rather than guesswork.
For more strategies on menu pricing, including psychological tactics and category-specific approaches, see our detailed guide.
Theory means nothing without implementation. Here’s how to put menu engineering into practice at your restaurant, with realistic timelines and expectations.
Restaurants see measurable improvements within 2-4 weeks of implementation, with full optimization requiring ongoing iteration.
What you need:
Where to get it:
Common pitfall: Don’t overcomplicate your first menu analysis. Start with your top 20 sellers and expand from there.
For each menu item, calculate:
Then calculate your thresholds:
Plot each item on the matrix based on whether it falls above or below your profitability and popularity thresholds.
Create a simple table or spreadsheet with:
Based on your classifications, create specific action items:
Stars: Maintain quality, verify prime placement, ensure staff enthusiasm
Plowhorses: Choose 1-2 tactics per item (price increase, portion adjustment, recipe change, add-on promotion)
Puzzles: Plan visibility improvements (better placement, enhanced descriptions, photos, staff recommendations)
Dogs: Decide: remove, retain with justification, or re-engineer
Apply your strategies to the actual menu:
Roll out your changes and monitor response:
Digital menu advantage: With Menubly, you can implement changes instantly—no waiting for reprints. Test different item placements, descriptions, and prices. See results in real-time and make data-driven decisions.
Menu engineering isn’t a one-time project—it’s an ongoing process.
Recommended review schedule:
One restaurant implementing these steps achieved:
Ready to put menu engineering into practice? With Menubly, you can update your menu instantly, test different strategies, and continuously optimize—all without reprinting costs or technical complexity. Create your free menu in minutes and start your 30-day trial. No credit card required.
Even well-intentioned menu engineering efforts can go wrong. Here are the most common mistakes and how to avoid them.
The mistake: Running menu analysis once and never revisiting it.
Why it happens: Reprinting menus is expensive and time-consuming, so restaurants avoid making changes.
How to avoid it: Schedule quarterly reviews minimum. Digital menus eliminate the cost barrier, making frequent analysis practical.
The mistake: Keeping dogs because “the chef loves that dish” or “we’ve always had it.”
Why it happens: Personal attachment to menu items.
How to avoid it: Let the data decide. If numbers don’t support an item, either fix it or remove it.
The mistake: Too many items creating decision paralysis and operational complexity.
Why it happens: Fear of not having something for everyone.
How to avoid it: Aim for 7-10 items per category maximum. Smaller menus often perform better.
The mistake: Keeping items that complicate kitchen operations without delivering profit.
Why it happens: Menu decisions made in isolation from kitchen reality.
How to avoid it: Factor prep time, ingredient uniqueness, and execution complexity into your analysis.
The mistake: Making multiple changes at once without tracking individual impact.
Why it happens: Eagerness to improve everything simultaneously.
How to avoid it: Change one variable at a time when possible. Give changes 2-4 weeks before evaluating.
The mistake: Pricing or positioning based on what competitors do without understanding your own costs.
Why it happens: Easier than doing original analysis.
How to avoid it: Use competitor pricing as one input, not the only factor. Your costs and positioning are unique.
The mistake: Rejecting high-margin items because their food cost percentage looks bad.
Why it happens: Traditional training emphasizes percentage targets.
How to avoid it: Focus on contribution margin dollars. A 40% food cost item that contributes $18 profit beats a 25% food cost item that contributes $8.
The mistake: Engineering a great menu but not telling servers which items to recommend.
Why it happens: Assuming the menu will do all the work.
How to avoid it: Train staff on your stars and puzzles. Give them talking points and incentives.
The mistake: Overhauling the entire menu in one update.
Why it happens: Enthusiasm after analysis reveals many opportunities.
How to avoid it: Prioritize changes by impact. Start with your top 3-5 opportunities.
The mistake: Making changes without measuring whether they worked.
Why it happens: Assuming changes will obviously work—or forgetting to follow up.
How to avoid it: Document baseline numbers before changes. Compare performance 2-4 weeks after implementation.
While core menu engineering principles apply universally, different types of restaurants need tailored approaches.
Focus on experience over volume. Tasting menus and prix fixe options simplify engineering while maintaining premium positioning. Wine and beverage pairings often offer the highest margins. Emphasize storytelling in descriptions—provenance, technique, and chef inspiration. Price anchoring with luxury items makes other high-margin dishes seem reasonable.
Balance variety with profitability. Family-friendly options are necessary but often lower margin—engineer them carefully. Appetizer and dessert categories offer margin opportunities that offset lower-margin mains. Focus on add-ons and upgrades to boost check averages without changing base prices.
Speed is paramount—menu engineering must not slow service. Combo engineering is critical: bundle items to increase perceived value while protecting margins. Upsell prompts (size upgrades, add-ons) are your primary profit lever. Keep the core menu tight; use limited-time offers for variety.
Customization options (size, milk alternatives, flavor shots) multiply your menu without adding complexity. Pastry and food pairings with coffee offer strong margins. Digital menus excel here—with Menubly’s add-on feature, you can easily set up size and milk alternatives. Pickup and takeaway ordering are essential.
Beverage margins typically exceed food—focus engineering efforts on drinks. Food serves to extend customer stay and increase drink consumption. Happy hour engineering requires careful margin management. Signature cocktails offer best margin opportunities.
Limited menu optimization is critical—you don’t have space for dogs. Speed of service affects revenue; remove anything that slows the line. Visual impact matters for walk-up ordering. Digital menus shine here—food trucks can update locations and menus on the go with Menubly.
Daily specials create urgency and allow margin flexibility. Pre-ordering and pickup optimization reduce waste. Mark items sold out instantly when the last croissant sells—something digital menus handle automatically. Seasonal offerings keep the menu fresh without permanent changes.
Package optimization is your primary engineering focus. Per-head pricing simplifies customer decisions while protecting margins. Customization should be priced to encourage profitable add-ons. Showcase menu options clearly with strong visuals and detailed descriptions.
Traditional menu engineering required significant investment: printing costs, design fees, and the time lag between analysis and implementation. Digital menus have removed these barriers, making menu engineering practical for restaurants of any size.
1. Instant Updates
Test menu engineering changes immediately. Move a puzzle to a prime position, update a plowhorse’s price, or remove a dog—changes go live in seconds, not weeks. This speed transforms menu engineering from a periodic project to an ongoing optimization process.
2. Zero Update Costs
No reprinting means no barrier to iteration. Traditional restaurants might delay important changes because reprinting costs hundreds of dollars. With digital menus, every improvement is free to implement.
3. Real A/B Testing
Test different descriptions, placements, and prices with real customers. See what actually drives orders rather than guessing. The menu engineering process becomes data-driven in real-time.
4. Better Visual Presentation
High-quality photos increase sales by 30%+, but professional printing with images is expensive. Digital menus include photos at no extra cost, and you can update images anytime.
5. Mobile-Optimized Experience
PDF menus look terrible on phones—customers have to pinch, zoom, and scroll awkwardly. Digital menus are designed for mobile viewing, with easy search, category filtering, and clear, readable text.
6. Integrated Data Collection
With QR code menus and online ordering, you capture exactly what customers order. No manual tracking or estimation—real data for real analysis.
| Aspect | Traditional Menu | Digital Menu |
|---|---|---|
| Update time | Weeks | Seconds |
| Update cost | $100-500+ | $0 |
| Testing ability | Limited | Unlimited |
| Photo inclusion | Expensive | Included |
| Mobile experience | Poor | Optimized |
| Menu engineering frequency | Quarterly at best | Continuous |
Menubly gives you everything you need: instant updates, beautiful mobile-friendly menus, and optional commission-free ordering—all for $9.99/month.
What’s included:
Start your free 30-day trial and see how digital menus transform your menu engineering capabilities. Create your menu in minutes—no technical skills required. Sign up now.
Review your menu engineering quarterly at minimum, monthly for high-volume restaurants, and immediately after significant changes like price increases or new item additions. Digital menus make continuous review practical by eliminating update costs.
Research suggests 7-10 items per category is optimal for customer decision-making. Total menu size depends on restaurant type—fine dining may have 20-25 items while fast food works best with 15-20. Fewer items typically means better menu performance and kitchen efficiency.
Target 28-35% for full-service restaurants and 25-30% for quick service. However, contribution margin matters more than percentage—a 40% food cost item generating $18 profit beats a 25% food cost item generating $8 profit.
Absolutely. Smaller menus often see bigger impact from menu engineering because each item represents a larger percentage of sales. A food truck with 10 items can transform profitability by optimizing just 2-3 items.
Track contribution margin per guest, watch for menu mix shifts toward high-profit items, and monitor overall food cost percentage. Successful engineering shows up in these metrics within 2-4 weeks of implementation.
Not necessarily. Some dogs serve strategic purposes—kids menu items keep families coming, certain dishes complete a logical menu section, or items may use ingredients that would otherwise be wasted. Evaluate each dog individually before removing.
High-quality photos can increase item sales by 30% or more. However, poor-quality photos actually hurt sales—they’re worse than no photos. Invest in good photography for your stars and puzzles.
The best format depends on your restaurant type and customer expectations. Digital menus offer the most flexibility—easy updates, mobile optimization, and the ability to test different layouts. They work well for most restaurant types.
Focus training on recommending stars and puzzles. Give servers talking points about high-margin items, explain why certain dishes are important, and consider incentives for selling target items. Staff recommendations significantly influence customer choices.
Initial changes show impact within 2-4 weeks. You’ll see menu mix shifts, changes in average check, and movement in food costs. Full optimization is ongoing—the best restaurants treat menu engineering as a continuous process rather than a one-time project.
Menu engineering transforms your menu from a simple price list into a strategic profit driver. The methodology is straightforward: analyze profitability and popularity, classify items using the matrix, and apply targeted strategies to each category.
Every improvement you make compounds over time. A 3% price increase on a plowhorse, a visibility boost for a puzzle, the removal of a dog that complicated your kitchen—each change adds up to significant profit impact.
Ready to start? With Menubly, you can update your menu instantly, test different strategies, and optimize your menu continuously—all without reprinting costs or technical complexity. Create your free digital menu today and start your 30-day trial. No credit card required.
Your menu is more than a list of dishes—it’s your most powerful tool for profitability. Start engineering it today.